
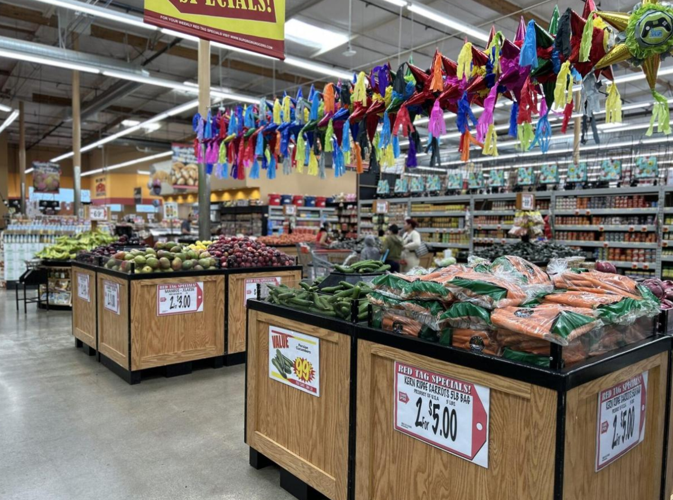


Recently SNAP has had the largest cut to the program since it began in 1964. (Photo by Amairani.)
The Supplemental Nutrition Assistance Program (SNAP) helps serve 42 million people in the U.S., providing essential food support for families, children, the elderly and those with disabilities. However, last year the budget was cut by $187 billion through 2034, resulting in three million Americans losing SNAP benefits between July 2025 and January 2026.
Since Congress passed H.R.1, also known as the “One Big Beautiful Bill Act,” it has cut critical health and food safety nets and imposed new eligibility requirements.
The American Community Media, in partnership with the Robert Wood Johnson Foundation (RWJF), which is the U.S.'s largest health-focused philanthropy, hosted a briefing examining how new SNAP participation data can track quarterly changes in enrollment alongside 40 other health and economic dashboard metrics. Additionally, speakers also highlighted key findings and discussed how families and individuals will be impacted by the program cuts.
Dr. Giridhar Mallya, public health physician and senior policy officer with RWJF, said that as more parts of the bill take effect, it’s likely that another million people could either lose or see a reduction in benefits.
“We need clear, credible data to ensure that decisions in Washington and across the country reflect the real needs of communities. Kids, people with disabilities, veterans and older adults should be left wondering if they can afford their next meal,” Dr. Mallya said, noting that four in 10 people receiving SNAP in the U.S. are children.

Dr. Giridhar Mallya. (Photo courtesy of The American Community Media.)
In addition to U.S. citizens, green card holders are eligible for SNAP after a five-year waiting period, but undocumented immigrants are not eligible for SNAP and never have been. “To fully understand both the reach of SNAP and the real-world impacts of current policy changes, high-quality data is essential. At RWJF, local data is viewed as key to informing policy change, strengthening accountability, and driving collective action,” Dr. Mallya said. “That is why we've invested in tools like the Congressional District Health Dashboard (CDHD).”
He also shared that partners have reported difficulty accessing reliable data at the congressional district level to effectively engage policymakers on urgent health and well-being issues.
Dr. Lorna E. Thorpe, Co-Principal Investigator of the CDHD, said the dashboard’s mission is to provide data on more than 40 health measures and factors that affect health, broken down by each congressional district across the country. The data will be updated twice a year to reflect new congressional district boundaries when they are modified.
“At a time when SNAP policy is actively changing, timely local data on SNAP participation is more important than ever. A new SNAP metric has been introduced that measures the percentage of households participating in SNAP. These estimates are generated by combining data from the American Community Survey and the U.S. Department of Agriculture’s Food and Nutrition Service,” she said.
The dashboard does not only show health outcomes but also the conditions that shape health, including housing, education, income, access to care and SNAP participation. “SNAP now sits alongside these measures, helping connect the effects of federal nutrition policy to broader community health outcomes,” Dr. Thorpe said.

Dr. Lorna E. Thorpe. (Photo courtesy of the American Community Media.)
Some of the key takeaways from the data demonstrated that SNAP participation has changed over time. Across all congressional districts, more than one in six households in the U.S. participate in SNAP.
“This shows that SNAP is a major part of the country’s safety net, supporting low-income families and individuals,” Dr. Thorpe said, noting that between the end of 2022 and 2025, average participation only shifted slightly, ranging from a high of 17.9% of households in one quarter to a low of 17.2% in another.
“These changes may seem small, but even a fraction of a percentage point represents a significant number of households. For instance, the difference between 17.2% and 17.3% amounts to more than 130,000 households nationwide,” said Dr. Thorpe, adding that the dashboard was designed to be easy to use, allowing members of Congress, community advocates and journalists to quickly access and interpret the data.

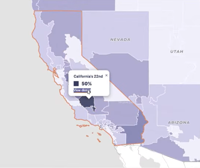
Snapshot of the data in Bakersfield.
On average, SNAP participation in California is higher than the national average across its congressional districts. “Certain areas, especially in the Central Valley, show particularly high rates. California’s 22nd District, which includes the Bakersfield area, has about half of households participating in SNAP. California’s 21st District, which includes the Fresno area, has over 50% participation,” Dr. Thorpe shared.
Dr. Mallya said that SNAP plays an important role in improving health. “As a family physician with years of public health experience, I see SNAP as one of the most effective public health programs in the country,” he said.
He also pointed out that one of the changes to SNAP and programs like Medicaid suggests that work requirements do not substantially boost employment. Instead, they tend to reduce participation, mainly because the documentation process is complicated and time-consuming for both working individuals and those seeking exemptions, including people with disabilities.
The second major change he pointed out is that the law moves a large part of SNAP costs from the federal government to the states. Beginning in October, they will be required to cover 75% of administrative expenses, up from 50%. “More significantly, starting in 2027, most states will also have to contribute to food benefit costs for the first time, covering anywhere from 5% to 15%, which could amount to hundreds of millions of dollars annually,” he said.

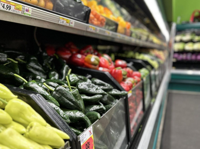
SNAP benefits help families, children, disabled and elderly people buy food. (Photo by Amairani Hernandez.)
The third major policy change takes away benefits from some lawfully present immigrants, including refugees, asylum seekers and trafficking survivors. “These changes, combined with broader anti-immigrant actions by the Trump administration, are contributing to a chilling effect and declining participation among eligible lawfully present immigrants, as well as U.S. citizen children in mixed-status families,” Dr. Mallya shared.
The fourth change reduces benefits for all SNAP participants over the next decade. Benefits will no longer be adjusted to keep up with inflation or rising costs, which effectively results in cuts for everyone in the program.
“SNAP’s budget will be reduced by nearly $190 billion, or about 20%, over the next decade. As a result, four million people, including 1 million children, will either lose access to benefits or see a significant reduction in the value of those benefits,” Dr. Mallya said. “That is why the new data from the CDHD are vital.”


(0) comments
Welcome to the discussion.
Log In
Keep it Clean. Please avoid obscene, vulgar, lewd, racist or sexually-oriented language.
PLEASE TURN OFF YOUR CAPS LOCK.
Don't Threaten. Threats of harming another person will not be tolerated.
Be Truthful. Don't knowingly lie about anyone or anything.
Be Nice. No racism, sexism or any sort of -ism that is degrading to another person.
Be Proactive. Use the 'Report' link on each comment to let us know of abusive posts.
Share with Us. We'd love to hear eyewitness accounts, the history behind an article.